Graphics
Graphics are important. This is something that is too often overlooked. Learning theory notes that a fair portion of the population are visual learners, and historically we have not given enough attention to these learners. Whether it’s courseware or general user documentation, meaningful graphics add significant value, overall.
Graphics should communicate without words, as much as possible. Here are two examples of graphics that I’ve created and a description of what each is intended to convey.
Title: After-imaging process
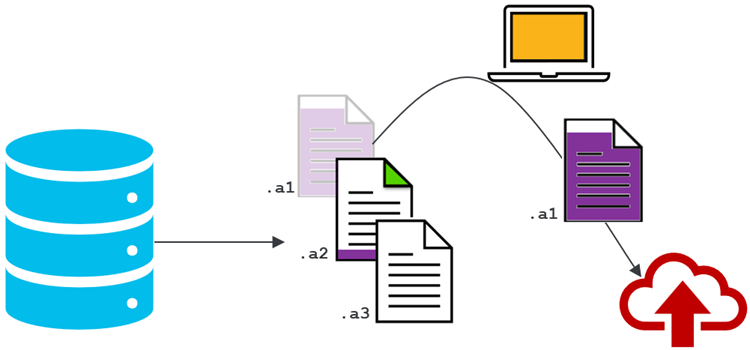
Description: PNG example of how to after-imaging works
Objective: This image shows that a database writes to a sequence of after-imaging (.a#) files. When one of the files becomes full (.a1 in the PNG), the active tag moves to the next file in the sequence (.a2 in the PNG) and the full file is deactivated. The computer indicates that a user then prompts the archiving (through varied methods), and finally, the file moves to the backup location.
Description: Animated GIF example of how after-imaging works
Objective: The objective for this image is the same is the same as above, but it shows more detail. This image shows that the process includes emptying the .a# file and logging the action before the data is archived.